Labour / Le Travail
Issue 95 (2025)
Article
Union Endorsements and the Voting Intentions of Union Members in Canada
Abstract: This article explores the impact of union endorsements on the voting intentions of union members in Canada. Through a survey of union members, the study reveals that while union endorsements generally do not significantly influence voting behaviour, satisfaction with one’s union enhances the likelihood of supporting union-endorsed candidates in federal, provincial, and local elections. This correlation underscores that having strongly supported unions in the workplace helps to build strong unions in the political arena with improved capacity to deliver union members’ votes. The findings also provide a basis for further research on the potential electoral significance of union endorsements.
Keywords: unions; elections; labour politics; political parties; federal politics; Québec
Résumé : Cet article examine l’impact des appuis syndicaux sur les intentions de vote des membres de syndicats au Canada. À partir d’un sondage auprès des membres de syndicats, l’étude révèle que même si les appuis syndicaux n’influencent généralement pas de manière significative le comportement électoral, la satisfaction à l’égard de son syndicat augmente la probabilité de soutenir les candidats appuyés par le syndicat aux élections fédérales, provinciales et locales. Cette corrélation souligne que le fait d’avoir fortement soutenu les syndicats sur le lieu de travail contribue à bâtir des syndicats forts sur la scène politique, avec une meilleure capacité à obtenir le vote des membres du syndicat. Les résultats fournissent également une base pour des recherches plus approfondies sur l’importance électorale potentielle des appuis syndicaux.
Mots clefs : syndicats; élections; syndicalisme et politique; partis politiques; politique fédérale; Québec
Union endorsements in election campaigns have gained a great deal of attention in Canadian politics in recent decades. From the weakening of formal party-union links between the New Democratic Party (ndp) and significant segments of the labour movement, to the changing partisan alignments of building and construction unions, the changing landscape of labour politics has significant implications for labour, political parties, and the party system and politics more generally.
While the social democratic ndp has never had a monopoly on union endorsements, the party was long viewed as the political arm of the labour movement, and union resources and endorsements outside of Québec reliably and overwhelmingly flowed to the ndp for much of its history. Beginning in 2004, the introduction of campaign finance reforms at the federal level that severely curbed and then altogether eliminated corporate and union donations to parties helped to change the nature of party-union relationships.1 While most unions have moved away from formal, partisan ties to the ndp, labour organizations are no less politically active. Rather, unions have increasingly experimented with alternative electoral approaches, including strategic voting, ad hoc political alliances with different parties, and third-party advertising.2
Many of these electoral strategies have relied on direct or indirect political endorsements by unions. But do union endorsements make a real difference at the ballot box? In this article, we tackle the question of union political endorsements along with several related questions: Do union members respond positively or negatively to endorsements? Are there regional, sectoral, or demographic factors that increase the likelihood that a union’s political endorsement will be well received by union members? Does the utility of a union’s political endorsement correlate to the union’s perceived effectiveness as a bargaining agent in the workplace?
We examine these interrelated questions with a view to providing much-needed insight about the relationship between union endorsements and the voting intentions of union members in Canada. Overall, our survey of union members found that while most indicated that endorsements would not sway their vote, satisfaction with one’s union did positively correlate with an increased likelihood of supporting union-endorsed candidates. Moreover, satisfaction with one’s union was the only variable that had a major influence on voting intentions in relation to union-endorsed candidates.
Background and Context
There are scant academic studies focused on the impact of union endorsements on the voting preferences of union members. Where they do exist, the research focuses on the role of union endorsements in municipal, school board, and statewide elections in the United States.3 A much broader literature is concerned with labour politics more generally, including the electoral influence, strategies, and tactics of labour unions as well as the changing nature of party-union relationships.4
Given the ndp’s long-standing relationship to the union movement in Canada, it should come as little surprise that most of the Canadian academic literature on labour and electoral politics focuses on the link between the ndp and union voters.5 Historically, New Democrats had more of a lock on union endorsements outside of Québec, at least among those unions active in electoral politics, than did other parties. The Canadian Labour Congress (clc), most provincial federations of labour, and many of the unions affiliated to these central labour organizations were founding partners of the ndp when it was launched as the political arm of organized labour in 1961.6 In the ndp’s early years, hundreds of locals representing dozens of unions and thousands of union members affiliated to the party, but the overwhelming majority of affiliated union members came from four unions: Steel, Auto, Woodworkers, and Packinghouse workers.7 Some of these formal, partisan political partnerships have persisted, but most petered out. Most public-sector unions have never had formal ties to the ndp, with the notable exception of the Canadian Union of Public Employees (cupe), but have nonetheless become increasingly active in electoral politics.8 In the case of Québec’s labour movement, early interest in the ndp quickly faded. In that province, the ndp’s preference for centralization and its anglophone character were out of sync with the sovereigntist labour politics emerging in the wake of the Quiet Revolution.9 As a result, unions in Québec largely bypassed the ndp to ally themselves most closely with sovereigntist parties at both the provincial and federal levels, all while maintaining official political independence in the realm of electoral politics.10
Much of the research on labour and the ndp highlights what appears to be a disconnect between union leaders and union members on the question of support for the party. In 1976, Robert Laxer argued that while most national union leaders were ndp members and supporters, most union locals in Canada remained non-partisan or offered only “perfunctory” support to the party.11 Similarly, Desmond Morton observed that “the few unions that found the courage and the cash to survey their own members’ attitudes soon discovered that few of them had any allegiance to the labour movement’s political or social goals nor even to their own elected leaders.”12
Researchers have attributed the disconnect between union voters and the ndp to a number of unique contextual factors in Canadian federal politics. Throughout the 20th century, Canadian federal politics largely revolved around ethnocultural, religious, linguistic, and constitutional debates, the latter concerned mostly with Québec’s place within Canada.13 Contentious regional, linguistic, and constitutional questions have divided working-class voters and complicated the ndp’s electoral appeal, thus undermining the party’s attempts to realign Canadian politics along a left/right axis – as the British Labour Party had done in the United Kingdom.14 In addition, questions about the ndp’s electoral viability have led many union members to vote strategically for the Liberals even if they may have preferred the New Democrats.15 These factors have combined to undermine the effectiveness of union endorsements for the ndp.
Nevertheless, research consistently demonstrates that union membership makes voters somewhat more likely to vote ndp. Studies of the 1965, 1968, 1974, and 1979 federal elections revealed that union members were roughly twice as likely as their non-union counterparts to vote ndp.16 Richard Johnston, André Blais, Henry E. Brady, and Jean Crête found that union households were eight points more likely than non-union households to vote ndp in the 1988 federal election, and Johnston noted a consistent positive relationship between union membership and an increase in the likelihood of voting for the ndp (and its forerunner the Co-operative Commonwealth Federation) that runs from 1940 to 2011.17 Lynda Erickson and David Laycock found that being in a union household has consistently been “an important variable in the ndp vote equation.” They report that in 2004, union voters “were 1.6 times more likely to vote ndp than were non-union voters. This effect continued to be evident in the elections of 2006 and 2008, and in all three elections it remained significant when other socio-demographic factors were controlled.”18 Distinguishing among unions, Keith Archer found that in the 1979 federal election, 30% of members of ndp-affiliated unions reported voting for the party compared with just 20% of non-affiliated union members. This latter finding suggests that direct endorsements did make a difference. Even so, while union membership increased the likelihood that a worker would vote ndp, more union members continued to vote Liberal than ndp.19 In the 1965 election, “the ndp’s electoral core was labour but most workers chose one of the other parties,” explained Janine Brodie and Jane Jensen, thus reinforcing the idea that New Democrats were the party of the union leadership rather than the membership.20 In fact, ndp support among union voters never exceeded 25% in any federal election study between 1968 and 1984, despite reliable endorsements from union leaders.21
While the ndp historically had a tighter grip on union endorsements than union votes, the party’s relationship to important segments of the union leadership really began to fracture in the early 1990s as provincial ndp governments grappled with how to tackle mounting levels of public debt. This dynamic was most evident in Ontario, where Bob Rae’s ndp government stripped public-sector workers of their collective bargaining rights and imposed unpaid days off as part of its infamous Social Contract Act. The move proved wildly unpopular with union leaders and the ndp’s union supporters in Ontario but also contributed to a loss of labour support across the country. As far away as Newfoundland, candidates campaigning for the federal ndp were dogged by questions about the Social Contract in advance of the 1993 federal election.22 “The effect extended far beyond Ontario’s borders,” admitted Saskatchewan ndp provincial secretary Dick Proctor.23 “I get letters cancelling Saskatchewan ndp memberships because of things Rae has done,” he added. In response to the Social Contract, the Ontario Federation of Labour (ofl) declined to endorse the party’s re-election bid and the ndp was soundly defeated in the 1995 Ontario provincial election. The ofl and ndp have since reconciled, but Ontario’s labour movement remains among the most politically fractured in Canada.24
Although important segments of the union movement continue to hold special status as key party stakeholders, organized labour’s formal ties and influence within the party have diminished ever since.25 The party’s uneven record in office provincially, the changing composition of union membership, the impact of campaign finance reforms, and ongoing concerns about the party’s electoral viability have all contributed to a weakening of the union-party link.26 This is particularly true in provinces where the ndp is not electorally competitive and at the federal level, where the party has traditionally occupied the role of third or fourth party in the House of Commons. While the federal ndp reliably continues to secure endorsements from large unions like cupe, the Steelworkers, the United Food and Commercial Workers Union (ufcw), and the International Association of Machinists and Aerospace Workers (iamaw),27 it consistently struggles to convert those endorsements into votes.
Only the 2011 federal election stands out as the exception to this rule. For that campaign, Canadian Election Study data reveals that 37% of union members in the rest of Canada voted for the ndp, compared with 21% for the Liberals. In Québec, Ipsos-Reid data shows that 40% of union members backed the ndp.28 Winning 59 of 75 seats in Québec helped to propel the federal ndp into the role of official opposition for the first time in history. While the party garnered an unprecedented number of union votes in that election, the irony of the ndp’s “Orange Wave” is that it occurred in spite of the Québec labour leadership’s overwhelming support for the Bloc Québécois. Even after the ndp had overtaken the Bloc in public opinion polls in the province and was well on its way to securing the largest share of Québec seats, the province’s union leaders stuck with the Bloc and lashed out at the surging ndp.29 On election day, the ndp triumphed in Québec and the Bloc lost official party status. In the wake of the ndp’s historic breakthrough and Jack Layton’s untimely passing in August 2011, important segments of Québec’s labour movement gradually abandoned the Bloc as an electoral vehicle and unofficially rallied around the official opposition ndp in the run-up to the 2015 federal election.30 At the outset of the campaign, the union leadership viewed the ndp, now led by Tom Mulcair, as the party best positioned to defeat the Harper Conservatives. However, the ndp campaign faltered badly and the party ended up losing 43 of its seats in Québec. The Orange Wave had receded despite union endorsements and support that had eluded the party in Québec for decades. The juxtaposed results for the federal ndp in Québec in 2011 and 2015 suggest that union endorsements did not outweigh other factors that may have shaped vote choice in the province.
David McGrane argues that in 2015, the federal ndp’s union voter base abandoned the party in greater proportion than did non-union voters.31 This finding may reveal that union members’ votes were likely driven more by a desire to defeat the Harper Conservatives than by a wish to elect a pro-union ndp government. Anti-Conservative strategic voting, as practised by several key unions, however, cannot fully explain labour’s shift away from partisan allegiance to the ndp.
While defeating Conservatives has been a key electoral priority for a growing number of unions, so too have efforts to build transactional relationships with Liberal governments open to working with segments of the labour movement on an ad hoc basis. For example, after the McGuinty Liberals defeated Ontario’s Progressive Conservative (pc) government in the 2003 provincial election, the new government worked to consolidate support from autoworkers, teachers’ unions, and construction unions through targeted policy reforms and investments. In return, those unions endorsed a growing number of Liberal candidates and indirectly boosted Liberal fortunes through union-funded third-party organizations for the next three election campaigns.32
A similar dynamic emerged in federal politics when Justin Trudeau’s Liberals replaced the Harper Conservatives in 2015. In the wake of that victory, the federal Liberals repealed much of the Harper government’s anti-union legislation and signalled to unions that the government was open to meaningful consultation with organized labour on the public policy front. In fact, Trudeau was the first sitting prime minister to meet with the clc executive council in more than 50 years.33 Key unions responded to Liberal overtures by fostering ad hoc and transactional relationships with the government that further weakened partisan ties to the ndp. Unifor, Canada’s largest private-sector union, went so far as to invite Trudeau to address delegates at its 2016 constitutional convention. As journalist Chris Hall noted, the prime minister’s speech to Unifor members was “interrupted by standing ovations that, once upon a time, would have been reserved for the leader of the ndp.”34 In return, the government tapped Unifor’s president to assist the government with the renegotiation of the North American Free Trade Agreement.35 After the deal was secured, the union invited Trudeau and Foreign Affairs Minister Chrystia Freeland back to address Unifor members at their convention in advance of the 2019 federal election. The union’s continued call for strategic voting was widely interpreted as an endorsement of the Trudeau government’s re-election.36
The 2019 federal election campaign featured the highest-ever level of third-party union spending, at just over $6 million.37 This unprecedented mobilization was primarily driven by the fear that the Conservatives would regain power and pursue an aggressive anti-union agenda.38 As Figure 1 demonstrates, union-backed third-party election spending increased dramatically between 2000 and 2019 before declining in 2021.39 Despite the snap nature of the 2021 election campaign, however, unions still managed to spend over $3 million in an attempt to influence their members and the broader electorate.40 Again, this intervention was mostly designed to dissuade unions members from voting Conservative. Whereas union spending in election campaigns traditionally and overwhelmingly benefitted the ndp and its candidates, the lion’s share of union advertising in more recent campaigns has clearly been designed to benefit the most electorally viable electoral alternative to the Conservatives.41 This shift has reinforced closer electoral ties between some unions and the Liberal Party.42 Even this dynamic, however, is in flux, as Conservative leaders have started to reframe their party as working-class friendly to boost support among blue-collar union members, and unions have increasingly embraced ad hoc transactional relationships with governments of all stripes as opposed to exclusive partisan alliances with social democratic parties.43
Ontario pc Premier Doug Ford’s so-called labour charm offensive in the run-up to the 2022 provincial election demonstrated the potential electoral benefit of Conservative overtures to union leaders.44 As a sitting government, Ford’s pcs were well positioned to foster quid pro quo relationships with individual unions that were not otherwise partisan aligned. During the election campaign, an unprecedented eight construction unions endorsed Ford’s re-election campaign.45 Despite the pc government’s poor record on a whole host of labour issues, ranging from public-sector wage restraint to the clawing back of statutory paid sick days, the unions backed Ford because of the premier’s focus on and investments in infrastructure and development – the bread and butter of construction workers. The pc endorsements represented less than 5% of the province’s union membership but made a big splash in the media. By contrast, while the ndp’s union endorsers were much bigger and represented a much broader cross-section of workers, they barely registered in news coverage. Elsewhere, Larry Savage has argued that the union endorsements for Ford “proved much more valuable because they helped to build a media narrative that labour movement opposition to the government was not only fading, but converting into support.”46 The endorsements, Savage argued, also provided “pro-worker cover” for the government that seemed to resonate far beyond the ranks of construction unions, “making the pcs appear friendly to blue-collar workers more generally.” How union endorsements are interpreted by the voting public is relevant here. According to Savage, “union support for the ndp is expected and has traditionally been met with charges of labour domination by media pundits and political opponents. In contrast, union endorsements for the pcs were largely framed as an impressive gamechanger.”47 The point here is to underscore that not all union endorsements are created equal, but endorsements can play a critically important strategic role in election campaigns, depending on the dynamic. Given the wide spectrum of electoral engagement by unions in Canadian politics and the increasingly multi-partisan nature of union political endorsements, understanding the value, effects, and limitations of such endorsements is critically important.
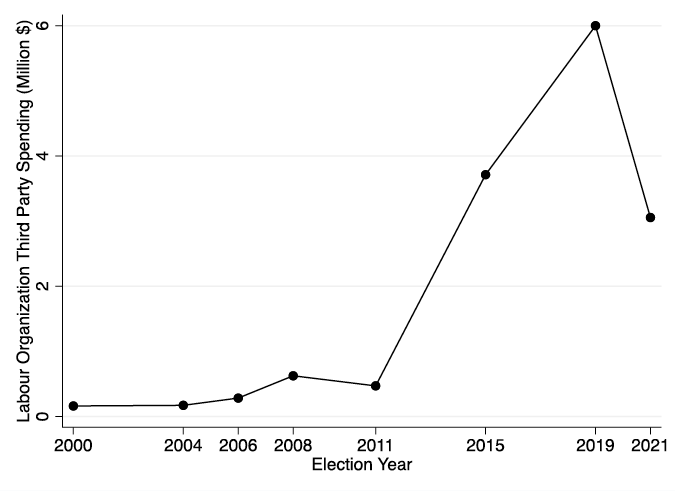
Figure 1. Labour organization third-party spending.
Source: Elections Canada, Third Party Financial Returns, 37th general election – November 27, 2000; 38th general election – June 28, 2004; 39th general election – January 23, 2006; 40th general election – October 14, 2008; 41st general election – May 2, 2011; 42nd general election – October 19, 2015; 43rd general election – October 21, 2019; 44th general election – September 20, 2021, https://www.elections.ca/content.aspx?section=fin&dir=oth/thi/advert&document=index&lang=e.
This leads us to pose several key questions: Do demographic factors affect how union members respond to endorsements? Are public-sector union members more responsive to endorsements than their private-sector counterparts? How does satisfaction with a union’s role as a bargaining agent shape members’ responsiveness to political endorsements? This latter question distinguishes our research from much of the public opinion polling focused on union members, which often centres on their electoral preferences rather than the nuanced effects of endorsements.
It is well established that voters often use heuristics when deciding which candidates or parties to support. Endorsements serve as one such heuristic, allowing voters to position themselves in relation to political candidates based on the credibility of the endorsing organization. If a voter perceives the endorsing organization as credible and supportive of their interests, they are more likely to support the endorsed candidate. Conversely, endorsements by organizations viewed negatively can have the opposite effect, making voters less likely to support the candidate.48 These cognitive shortcuts allow voters to navigate often overwhelming amounts of information during election campaigns.
We hypothesize that a significant share of union members may use their union as a heuristic in political decision-making and that satisfaction with the union in the workplace will affect whether they view the union as effectively advocating for their political interests as well. In short, trust and goodwill, built through effective representation in employment matters, can be leveraged to make political endorsements more persuasive. In contrast, unions that fail to cultivate trust may struggle to convince members to take their political endorsements seriously.
Data and Methods
To examine union members’ responsiveness to union endorsements, we ran a custom survey of union members in Canada using the survey firm ekos. The survey included three waves: one in September 2023, one in January 2024, and one in April 2024. All respondents were members of unions and drawn at random from ekos’ online panel.49 Because of the limited number of union members in ekos’ panel, some respondents are included in multiple waves of the survey. Over the three waves we had 1,953 unique respondents. Of those respondents, 1,127 (57%) were surveyed only once, 62 (29%) were surveyed in two of the waves, and 264 (14%) were contacted in all three waves. Our analysis relies on the pooled survey responses, using the most recent response for each respondent. We also conducted a number of robustness checks, detailed in the appendix. Robustness checks are designed to give us confidence that different methodological choices would produce similar results. First, we conducted separate analyses on each wave of the survey instead of analyzing the waves together (Appendix B). Second, instead of just looking at a respondent’s latest answers, we averaged their opinion responses if they answered the survey more than once (Appendix C). Both the analysis on the separate waves of the survey and the use of an average of responses instead of a respondent’s latest response produced similar results to the ones discussed in the main body of the paper.
In the survey, we asked union members if a union endorsement significantly increases, somewhat increases, does not affect, somewhat decreases, or significantly decreases their likelihood of supporting a candidate. We asked this about candidates at the federal, provincial, and municipal levels. To analyze the data consistently, we converted these responses into a scale from -1 to 1. A score of -1 means the respondent is much less likely to support a candidate endorsed by the union, while a score of 1 means they are much more likely to support a candidate endorsed by their union.
For practical reasons, survey respondents were not provided with information about which candidates or parties their union had endorsed. In some cases, unions endorse candidates from multiple parties, while in others, they may strategically wait until an election is called to announce endorsements. Some unions do not endorse candidates at all. This limits our ability to assess whether alignment between a union’s endorsement and a member’s political preferences influences their responsiveness to the endorsement. Nevertheless, we think our analysis still offers valuable insights into the overall impact of union endorsements, especially in the context of shifting party-union relationships.
Our analysis takes an average of respondents’ responses to questions about federal, provincial, and municipal candidates. We include a separate analysis of the relationship between satisfaction and responsiveness to union endorsements for each level of government in Appendix D. These analyses show relatively consistent effects for analysis focused on each level of government. In the main body of the paper, however, we do include comparisons of the mean responsiveness to union endorsements by level of government.
While the responsiveness of union members to endorsements by their unions constitutes the dependent variable of interest in our analysis, the main explanatory variable of interest is union members’ level of satisfaction with their union. Here we asked respondents whether they are very satisfied, somewhat satisfied, neither satisfied nor dissatisfied, somewhat dissatisfied, or very dissatisfied with the way their union represents them at their job. We similarly rescaled responses along a -1 to 1 scale, with -1 representing respondents who were very dissatisfied with their union and 1 representing those who were very satisfied with their union.
We included a number of additional explanatory variables that capture types of unions as well as several demographic variables. Respondents were asked whether they were a member of a public- or private-sector union and to identify their specific union. From these two questions we were able to generate binary (dummy) variables for whether respondents were members of public-sector unions, unions that have affiliations to the ndp,50 and unions in the building and construction trades sector.51 For analyses looking at respondents in Québec, we dropped the variable for whether a respondent is a member of a union affiliated to the ndp because most unions, including those affiliated to the ndp, respect the right of their Québec sections to endorse different parties.
We include demographic variables for the gender52 of the respondent, their age, income, whether they have a university degree, and whether they have a college or similar qualification above a high school diploma but below a bachelor’s degree. For respondents in the rest of Canada, we also include a variable for the respondent’s home region (Atlantic Canada, Ontario, western Canada, and the North).53
Finally, we include variables for the last wave of the survey to account for potential changes over time and correlations between survey waves. We adjusted for correlations between the error term and the survey wave by clustering standard errors based on the last wave in which respondents participated.54
To account for differences between the demographic distribution of respondents in the survey and the population of union respondents, survey weights were applied to the analysis. The sample was weighted to match the gender, regional, age, and educational distribution of the union population in Canada. We also weighted to account for discrepancies between the proportion of respondents who belong to public-sector unions and the proportion who belong to private-sector unions. However, the decision to include or exclude a union sector from the weighting calculation does not lead to different results, as shown in Appendix E.55
Even though ordered logit models might be better fit for the five-point scale used in portions of the survey, we opted to use ordinary least squares (ols) regression for analysis. We made this methodological choice because ols models are simpler to understand and usually give similar results to multinomial logit models. The detailed results of the ordered logit models, however, can be found in Appendix F. The study presents ols results using margins plots for easier interpretation, focusing on the most relevant variables. Tables with the full set of control variables, R2, number of observations, and constants for each model are also available in Appendix A.
Results and Analysis
We start by reporting the distribution of responses for our two opinion-related variables: responsiveness to endorsement by the respondent’s union, and respondents’ satisfaction with their union. Figure 2 shows that a majority of respondents, both in Québec and in the rest of Canada, respond neither positively nor negatively to union endorsements. In the rest of Canada, 52% of respondents said a union endorsement would not affect how they would vote. In Québec, the proportion was higher at 60%. Nonetheless, the data revealed that unions have some ability to shape the votes cast by their members. Just over one-third of respondents in the rest of Canada (37%) indicated they would be “somewhat” or “much more likely” to vote for a party or candidate endorsed by their union. In Québec, the proportion was smaller at 27% but still substantial, at over a quarter of union members. Just 11% of respondents in the rest of Canada (and 13% in Québec) indicated a union endorsement would make them “somewhat” or “much less likely” to vote for their union’s preferred party or candidate.
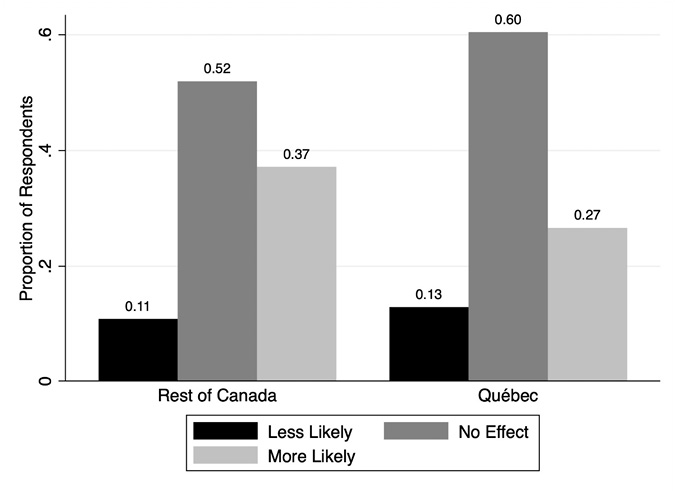
Figure 2. Responsiveness to union endorsement. Bars show the proportion of respondents based on their response to the questions about union endorsements. Those who say they would be “somewhat” or “much more likely” to vote for a union-endorsed candidate have been grouped together, as have those who say they would be “somewhat less” or “much less likely” to support a union-endorsed candidate.
While Figure 2 shows responsiveness to union endorsements across an average for all levels of government, we also broke down responsiveness to endorsements by the different levels of government. Recall that we created a scale for responsiveness to union endorsements where -1 means a respondent is “much less likely” to vote for a union-endorsed candidate or party, -0.5 means a respondent is “somewhat less likely,” 0 means they are “neither more nor less likely” to vote for such a candidate, 0.5 means they are “somewhat more likely” to vote for such a candidate, and 1 means they are “much more likely.” Figure 3 shows the average score on this scale for the three different levels of government included in the survey, dividing respondents between those in Québec and those in the rest of Canada. The average responsiveness to endorsements of federal parties and candidates for respondents in the rest of Canada was 0.084 points. This means the average respondent in the rest of Canada is just barely more likely to support a federal candidate endorsed by their union than a candidate not endorsed by their union. For endorsements of provincial parties and candidates, the average for respondents in the rest of Canada is 0.108, and for municipal candidates, it is 0.125.
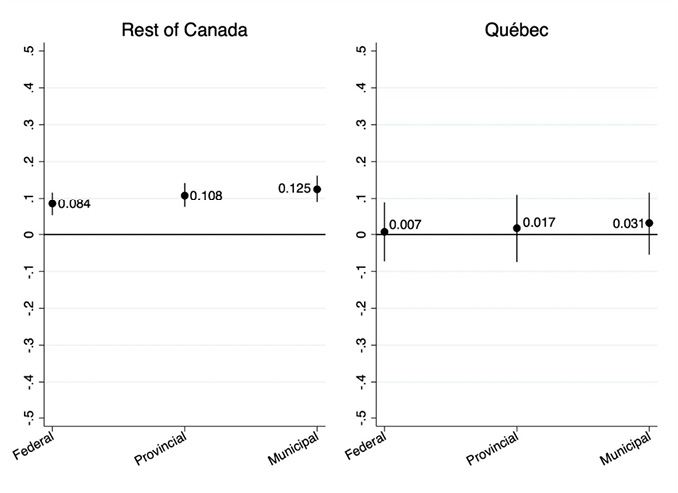
Figure 3. Mean responsiveness to endorsement by level of government. Dots show the mean responsiveness to union endorsement, and lines show the confidence range for a 95% confidence level.
It is one thing to have different estimates of respondents’ average responsiveness to union endorsements for candidates for different levels of government, but it is another to say whether these differences are meaningful. Here, we ask two questions. First, we ask whether the differences are statistically significant – that is to say, unlikely to be the result of random variation in survey respondents. Second, we ask whether the differences are substantive – that is, large enough to make a meaningful difference. To assess statistical significance, we run adjusted Wald tests, which determine whether the differences between two estimates are likely to be the result of random variation. These tests show that the differences between the average response to union endorsements of federal parties and candidates and provincial parties and candidates are statistically significant at the 99% confidence level. In other words, we are 99% confident that the differences in the averages for responsiveness to union endorsements of those two levels of government are not the result of random variation. The same can be said of the difference between the average responsiveness to endorsements of federal parties and candidates and municipal parties and candidates. By contrast, the differences between responsiveness to endorsements of provincial parties and candidates and municipal parties and candidates is not statistically significant.
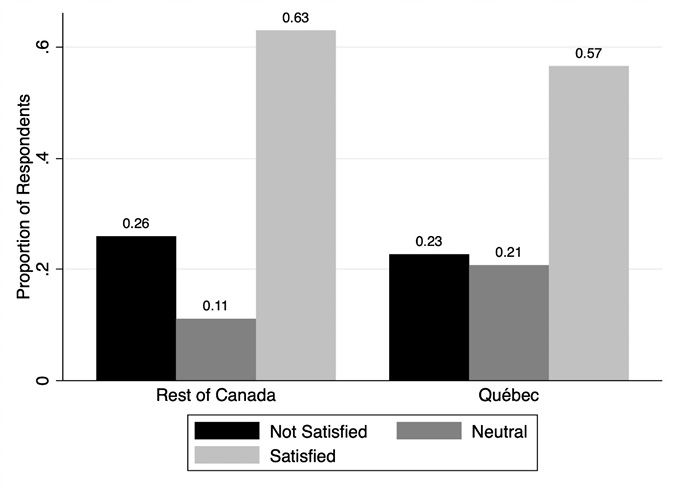
Figure 4. Satisfaction with union. Bars show the proportion of respondents based on their response to the question “How satisfied would you say you are with how your union represents your interests at your job?” Those who say they are “very satisfied” or “somewhat satisfied” with their union have been grouped together, as have those who say they are “somewhat dissatisfied” or “very dissatisfied.”
Even though the differences between responsiveness to endorsements of federal parties and candidates and endorsements of provincial or municipal parties and candidates are statistically significant, they are substantively small. For example, the difference between responsiveness to endorsements of federal parties and candidates and municipal parties and candidates is, at most, 0.11 points.56
In line with Figure 2, Figure 3 shows lower estimates for Quebeckers’ responsiveness to union endorsements than for respondents from the rest of Canada.57 In fact, our estimates for Quebeckers’ responsiveness to union endorsements is not statistically significantly different from 0 for any level of government. That is to say, the fact that our estimates for responsiveness to union endorsements in Québec are positive may be simply a result of random variation. The adjusted Wald test we conducted also suggests that the differences between endorsements at different levels of government in Québec are not statistically significant and are substantively small.58
If we expect that satisfaction with one’s union affects how responsive to political endorsements union members are likely to be, it is worth noting how satisfied individuals are with their union. Figure 4 shows that most respondents are satisfied with their union. In the rest of Canada, 63% of respondents report being “somewhat” or “very satisfied” with the job their union is doing representing their interests at work. In Québec, the number is slightly lower but still high at 57%. At the same time, 26% of respondents in the rest of Canada and 23% of respondents in Québec reported being dissatisfied with their unions. This spread is strategically important for unions as political actors for reasons that are made clear by the data in Figure 5.
We now turn to an analysis of the factors that are correlated with responsiveness to union endorsements. Figure 5 shows the correlations between our independent variables of interest and the degree to which a respondent from the rest of Canada would be more likely to vote for a candidate endorsed by their union. The clearest relationship in the analysis is between respondents’ satisfaction with their union and their likelihood of responding positively to an endorsement made by their union. Going from neutral to “very satisfied” with one’s union is corelated with a 0.3-point change in responsiveness to union endorsement. In other words, going from being “neither satisfied nor dissatisfied” with one’s union to being “very satisfied” is associated with going more than half the distance between being neutral to a union endorsement and being “somewhat more likely” to vote for an endorsed candidate. For someone who is already “somewhat more likely” to vote for a union-endorsed candidate, going from being neutral about one’s union to being “very satisfied” is associated with going more than half the distance between being “somewhat more likely” to vote for an endorsed candidate to being “much more likely” to vote for that candidate.
None of the other variables in the analysis have similarly large effects. The only other variable with an effect on responsiveness to union endorsement that is statistically significant at the 95% confidence level is the variable for gender. We estimate that gender accounts for a 0.05-point difference in a respondent’s responsiveness to a union endorsement, with women being more responsive to endorsements than men. There is thus some evidence that a gender gap is present in the way union members respond to endorsements that mirrors a gender gap in voting, where women are more likely to support either the Liberals or ndp over the Conservatives. However, the gender gap in responsiveness to union endorsements is substantively small, and we are unable to test the mechanisms that may lead to this gender gap with our data set. For context, the difference is very small compared with the 0.5-point difference in our responsiveness scale between someone who is unresponsive to a union endorsement and someone who is “somewhat more likely” to vote for a union-endorsed candidate. While we find evidence that suggests there is more to explore with respect to gender and responsiveness to union endorsements, we would caution against overstating the impact of gender.
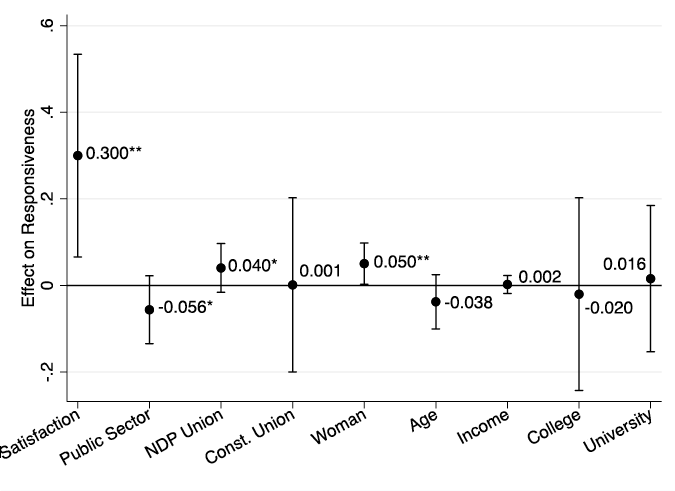
Figure 5. Effect on responsiveness to union endorsement (rest of Canada). Dots show estimates for the relationship between the variables and responsiveness to a union endorsement. Lines show margins of error for a 95% confidence level. A full regression table for this model is available in Appendix A.
* p <0.1, ** p <0.05, *** p <0.01, **** p <0.001.
The effects we find for the difference between public- and private-sector union members as well as ndp- and non-ndp-affiliated unions are similarly small and only statistically significant at the 90% confidence level. We estimate that members of public-sector unions are 0.056 points less responsive to union endorsements than members of private-sector unions. By contrast, members of ndp-affiliated unions are 0.04 points more likely to respond positively to a union endorsement than members of non-ndp-affiliated unions. However, these differences are negligible when compared with the 0.5-point difference in our responsiveness scale between someone who is unaffected by a union endorsement and someone who is “somewhat more likely” to vote for their union’s endorsed candidate. We cannot say with confidence that these variables do not matter at all, but at best, their impact on union members’ responsiveness to endorsements appears to be quite small. We thus caution readers not to make strong assumptions about the impact of union sector or partisan affiliation on responsiveness to union endorsements.
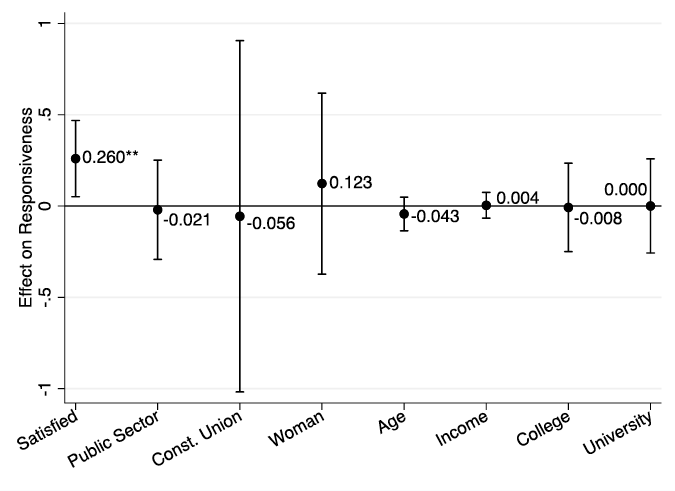
Figure 6. Effect on responsiveness to union endorsement (Québec). Dots show estimates for the relationship between the variables and responsiveness to a union endorsement. Lines show margins of error for a 95% confidence level. A full regression table for this model is available in Appendix A.
* p <0.1, ** p <0.05, *** p <0.01, **** p <0.001.
Our analysis of Québec reveals dynamics very similar to the ones we find for the rest of Canada. The only explanatory variable that comes through as statistically significant in the analysis of Québec respondents in Figure 6 is satisfaction with one’s union. The effect of satisfaction with one’s union in Québec is similar to its effect in the rest of Canada. Going from being “neither satisfied nor dissatisfied” with one’s union to being “very satisfied” correlates with a 0.26-point change in a respondent’s score in our responsiveness scale, or moving about half the distance between being unaffected by a union endorsement to being “somewhat more likely” to vote for a union-endorsed party or candidate. None of the other variables we included in the analysis had a clear effect on Quebeckers’ responsiveness to union endorsements.
Overall, these results suggest substantial space for unions to shape their members’ voting intentions. We show that a significant majority of union members are satisfied with the way their union represents them in the workplace. We also show that satisfied union members are more likely to indicate they would support parties and candidates endorsed by their union. However, it is important not to overstate the impact of union endorsements. After all, the majority of union members both in Québec and in the rest of Canada indicate that a union endorsement would not affect their vote one way or the other.
To account for the possibility that correlations exist between union characteristics or demographic variables and union members’ satisfaction levels, thus obscuring the effects of other variables in the model, we reran the models excluding the satisfaction variable (the corresponding regression tables can be found in Appendix A). When satisfaction is excluded, both the effects of being in a public-sector union and gender become marginally stronger than when satisfaction is included.
Specifically, when satisfaction is not considered, members of public-sector unions outside Québec are 0.064 points less likely to respond to union endorsements compared with members of private-sector unions, as opposed to 0.056 points less likely in the original model. This effect also goes from being statistically significant at the 90% confidence level to being significant at the 95% confidence level. However, it is important to note that on our scale, a 0.5-point change represents a shift from being unresponsive to a union endorsement to being “somewhat more likely” to support the endorsed party or candidate. Therefore, a 0.064-point change is relatively small, suggesting that while some of the effect of public-sector union membership may be mediated through its impact on satisfaction, the overall effect on responsiveness to voting decisions remains limited.
A similar observation applies to gender. When satisfaction is excluded, women outside Québec become 0.084 points more likely to respond positively to union endorsements, compared with 0.050 points in the original model. Although this effect is larger than that observed for public-sector union membership, it remains minor when viewed against the 0.5-point difference between unresponsiveness and being “somewhat more likely” to support a union-endorsed party. Thus, even if gender’s effect is partially mediated by union satisfaction, its overall impact on endorsement responsiveness remains modest relative to satisfaction.
Finally, when we exclude the satisfaction variable from our analysis of respondents in Québec, none of the union characteristic or demographic variables reaches statistical significance. This suggests that the satisfaction variable does not obscure other potential effects that could have emerged in our analysis.
Conclusions and Future Research
Overall, our data suggests that unions’ political endorsements matter. Our specific finding that union endorsements can have a modest impact on the electoral behaviour of union members suggests that labour organizations and their nearly four million members can potentially play a pivotal role in determining election outcomes at all levels, particularly in communities where union density is higher than average. This finding is relevant for unions, parties, and their respective strategists for electoral reasons, but also because it partially validates the increased level of resources unions have poured into campaigns and advertising designed to bolster particular candidates or parties through formal endorsements.
While our study demonstrates that unions’ political endorsements have a modest impact on the vote choice of union members, the clearest finding is that satisfaction with one’s union substantively correlates with an increased likelihood of supporting union-endorsed candidates. In short, our findings support the idea that having strongly supported unions in the workplace helps to build strong unions in the political arena with improved capacity to deliver union members’ votes.
By contrast, we find little indication that the characteristics of unions or the demographics of union members do much to explain differences in members’ responsiveness to endorsements. Effects for both types of variables are rarely statistically significant, and when they are, the effects are substantively small. This suggests that trust in the union as a bargaining agent is far more important to a union’s ability to influence its members’ vote choices than the characteristics of the union or the demographics of the union’s members.
Nevertheless, our research suggests a need for more work to further understand the relationship between union endorsements and the voting behaviour of union members. As is the case with all observational research, there are limits to what we can conclude about the causal relationships between satisfaction with one’s union and responsiveness to union endorsements.59 To further explore this dynamic, one could rely on more complex dependent variables. For instance, one could ask respondents whether they would be willing to follow a union endorsement even if it contradicted their own electoral preferences. It may also be worth examining whether union endorsements are more effective when unions endorse candidates from specific parties or if the perceived closeness of a particular political race changes respondents’ views. There is also a need for more research on how unions approach endorsements. Here, it is worth examining how endorsements are sought and granted, and the degree to which unions advertise endorsements to their members. We hope our study can serve as an important jumping-off point for further research, survey experiments, and observational analysis exploring the relationships between union endorsements and vote choice.
Appendix A: Full Regression Table for the Models in the Main Body of the Paper
|
Rest of Canada |
Québec |
|||
|
Model 1 |
Model 2 |
Model 1 |
Model 2 |
|
|---|---|---|---|---|
|
Satisfaction |
0.300** (0.054) |
0.260** (0.049) |
||
|
Public sector |
-0.064** (0.015) |
-0.056* (0.018) |
-0.060 (0.104) |
-0.021 (0.063) |
|
ndp union |
0.007 (0.013) |
0.040* (0.013) |
||
|
Construction union |
0.010 (0.059) |
0.001 (0.047) |
0.021 (0.186) |
-0.056 (0.224) |
|
Atlantic |
-0.086 (0.036) |
-0.060 (0.033) |
||
|
West |
-0.023 (0.082) |
-0.009 (0.058) |
||
|
North |
0.059 (0.026) |
0.055 (0.031) |
||
|
Woman |
0.084** (0.014) |
0.050** (0.011) |
0.145 (0.120) |
0.123 (0.115) |
|
Nonbinary |
0.088 (0.196) |
-0.023 (0.217) |
-1.037** (0.145) |
-1.125 (0.092) |
|
Age |
-0.027* (0.009) |
-0.038 (0.015) |
-0.050 (0.022) |
-0.043 (0.021) |
|
Income |
-0.001 (0.003) |
0.002 (0.005) |
0.008 (0.024) |
0.004 (0.016) |
|
University |
0.059 (0.033) |
0.016 (0.039) |
-0.035 (0.060) |
0.000 (0.060) |
|
Below bachelor Post-secondary |
-0.006 (0.055) |
-0.020 (0.052) |
-0.047 (0.055) |
-0.008 (0.056) |
|
January response |
-0.050*** (0.002) |
-0.037** (0.004) |
0.106* (0.029) |
0.147** (0.032) |
|
April response |
-0.052** (0.007) |
-0.019 (0.010) |
0.038 (0.018) |
0.047 (0.023) |
|
Constant |
0.194 |
0.112 |
-0.026 |
-0.123 |
|
R2 |
0.432 |
0.385 |
0.430 |
0.407 |
|
Observations |
1326 |
1319 |
361 |
359 |
Note: Standard errors are in parentheses.
* p <0.1, ** p <0.05, *** p <0.01, **** p <0.001
Appendix B: Analysis on Separate Waves of the Survey
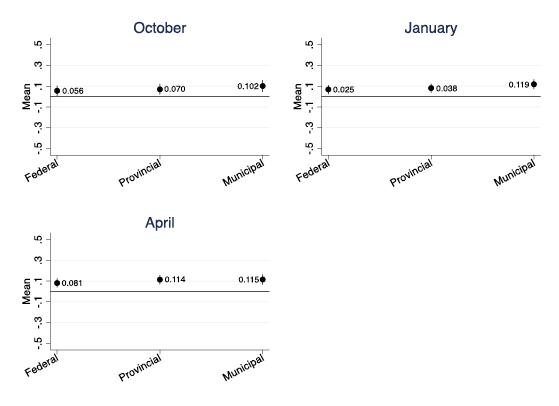
Figure B1. Mean responsiveness to endorsement by level of government (rest of Canada). Dots show the mean responsiveness to union endorsement; lines show the confidence range for a 95% confidence level.
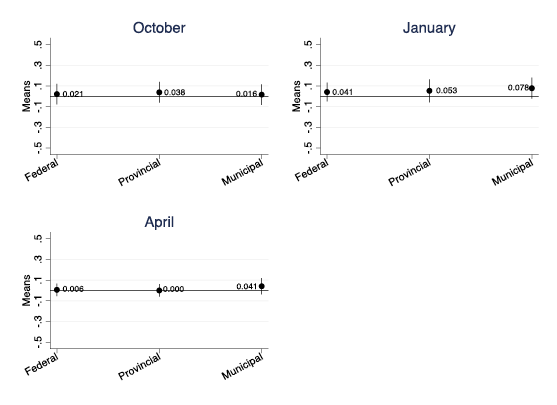
Figure B2. Mean responsiveness to endorsement by level of government (Québec). Dots show the mean responsiveness to union endorsement; lines show the confidence range for a 95% confidence level.
|
October wave |
January wave |
April wave |
||||
|---|---|---|---|---|---|---|
|
Model 1 |
Model 2 |
Model 1 |
Model 2 |
Model 1 |
Model 2 |
|
|
Satisfaction |
0.395**** (0.037) |
0.261**** (0.036) |
0.292**** (0.038) |
|||
|
Public sector |
0.055 (0.066) |
-0.026 (0.054) |
-0.091* (0.048) |
-0.087* (0.047) |
-0.046 (0.061) |
-0.081 (0.057) |
|
ndp union |
-0.032 (0.068) |
-0.009 (0.057) |
-0.043 (0.055) |
-0.074 (0.053) |
-0.001 (0.067) |
0.017 (0.060) |
|
Construction union |
-0.044 (0.082) |
-0.098 (0.077) |
-0.134** (0.066) |
-0.096 (0.074) |
0.101 (0.083) |
0.057 (0.088) |
|
Atlantic |
-0.187** (0.080) |
-0.126 (0.082) |
-0.130** (0.063) |
-0.087 (0.069) |
-0.155** (0.073) |
-0.096 (0.071) |
|
West |
-0.048 (0.062) |
-0.017 (0.050) |
-0.084* (0.048) |
-0.081* (0.044) |
-0.115** (0.050) |
-0.072* (0.044) |
|
North |
-0.283** (0.140) |
-0.193** (0.081) |
-0.051 (0.085) |
0.001 (0.074) |
0.108 (0.110) |
0.205*** (0.059) |
|
Woman |
0.055 (0.057) |
0.024 (0.050) |
0.111** (0.046) |
0.085* (0.044) |
0.099** (0.049) |
0.080* (0.043) |
|
Nonbinary |
0.173 (0.158) |
0.297** (0.127) |
0.465** (0.190) |
0.333* (0.171) |
0.067 (0.160) |
-0.069 (0.141) |
|
Age |
-0.006 (0.025) |
-0.028 (0.020) |
-0.006 (0.020) |
-0.009 (0.018) |
-0.031 (0.020) |
-0.046*** (0.018) |
|
Income |
-0.007 (0.014) |
-0.002 (0.011) |
-0.004 (0.013) |
-0.006 (0.012) |
0.007 (0.011) |
0.009 (0.010) |
|
University |
0.096 (0.086) |
-0.027 (0.065) |
0.068 (0.051) |
0.097* (0.058) |
-0.003 (0.069) |
-0.037 (0.057) |
|
Below bachelor |
-0.002 (0.084) |
-0.118* (0.063) |
0.008 (0.052) |
0.053 (0.058) |
-0.105 (0.073) |
-0.114* (0.060) |
|
Constant |
0.171 |
0.131 |
0.179 |
0.115 |
0.172 |
0.143 |
|
R2 |
0.477 |
0.403 |
0.415 |
0.375 |
0.416 |
0.374 |
|
Observations |
666 |
659 |
686 |
679 |
683 |
681 |
Note: Standard errors are in parentheses.
* p <0.1, ** p <0.05, *** p <0.01, **** p <0.001
|
October wave |
January wave |
April wave |
||||
|---|---|---|---|---|---|---|
|
Model 1 |
Model 2 |
Model 1 |
Model 2 |
Model 1 |
Model 2 |
|
|
Satisfaction |
0.248*** (0.086) |
0.395**** (0.092) |
0.192*** (0.061) |
|||
|
Public sector |
0.007 (0.099) |
0.056 (0.089) |
0.133 (0.152) |
0.120 (0.121) |
0.094 (0.084) |
0.096 (0.082) |
|
Construction union |
0.127 (0.195) |
0.141 (0.179) |
0.125 (0.134) |
-0.101 (0.172) |
-0.241 (0.234) |
-0.331* (0.182) |
|
Woman |
0.159 (0.114) |
0.138 (0.102) |
0.095 (0.104) |
0.104 (0.085) |
-0.022 (0.062) |
-0.035 (0.059) |
|
Nonbinary |
empty cell |
empty cell |
-1.213**** (0.190) |
-1.226**** (0.153) |
empty cell |
empty cell |
|
Age |
-0.009 (0.042) |
0.005 (0.037) |
-0.084* (0.048) |
-0.086** (0.038) |
-0.059** (0.027) |
-0.055** (0.025) |
|
Income |
-0.013 (0.022) |
-0.011 (0.020) |
-0.003 (0.019) |
-0.031* (0.017) |
0.027* (0.014) |
0.018 (0.014) |
|
University |
-0.078 (0.293) |
-0.065 (0.267) |
-0.207 (0.152) |
-0.133 (0.137) |
-0.023 (0.133) |
-0.000 (0.123) |
|
Below bachelor |
-0.032 (0.286) |
-0.020 (0.264) |
-0.163 (0.157) |
-0.088 (0.142) |
0.001 (0.130) |
0.030 (0.118) |
|
Constant |
0.096 |
-0.033 |
0.188 |
0.269 |
-0.156 |
-0.167 |
|
R2 |
0.432 |
0.413 |
0.435 |
0.380 |
0.355 |
0.335 |
|
Observations |
207 |
206 |
185 |
182 |
194 |
193 |
Note: Standard errors are in parentheses.
* p <0.1, ** p <0.05, *** p <0.01, **** p <0.001
Appendix C: Analysis on Respondents Mean Response over Different Waves Instead of Latest Response
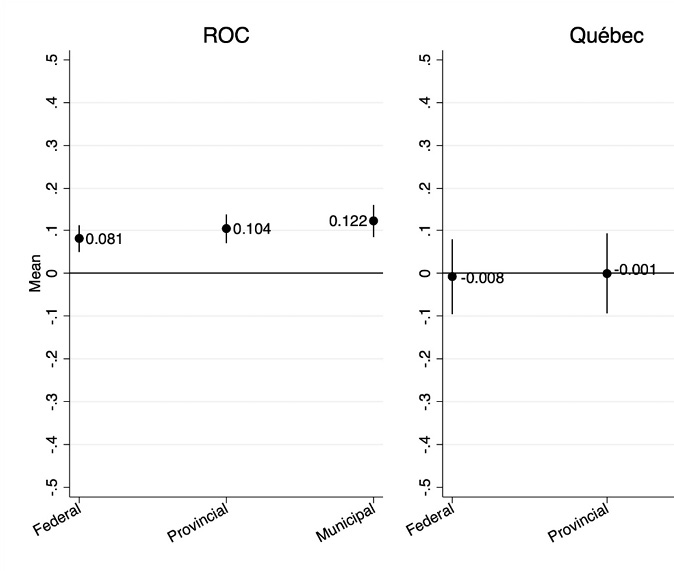
Figure C1. Mean responsiveness to endorsement by level of government. Dots show the mean responsiveness to union endorsement, and lines show the confidence range for a 95% confidence level.
|
Rest of Canada |
Québec |
|||
|---|---|---|---|---|
|
Model 1 |
Model 2 |
Model 1 |
Model 2 |
|
|
Satisfaction |
0.306*** (0.053) |
0.315**** (0.018) |
||
|
Public sector |
-0.094** (0.037) |
-0.076* (0.034) |
-0.016 (0.084) |
0.044 (0.052) |
|
ndp union |
-0.006 (0.026) |
0.029 (0.035) |
||
|
Construction union |
-0.002 (0.081) |
-0.007 (0.053) |
0.001 (0.180) |
-0.038 (0.176) |
|
Atlantic |
-0.103* (0.044) |
-0.069 (0.052) |
||
|
West |
-0.035 (0.060) |
-0.015 (0.047) |
||
|
North |
0.085 (0.083) |
0.119 (0.078) |
||
|
Woman |
0.085** (0.023) |
0.048 (0.030) |
0.176* (0.082) |
0.154* (0.075) |
|
Nonbinary |
0.111 (0.179) |
-0.036 (0.193) |
-0.959**** (0.121) |
-1.125**** (0.086) |
|
Age |
-0.024* (0.011) |
-0.035** (0.014) |
-0.040 (0.022) |
-0.020 (0.018) |
|
Income |
-0.001 (0.004) |
0.001 (0.004) |
-0.002 (0.017) |
-0.009 (0.011) |
|
University |
0.118* (0.052) |
0.062 (0.051) |
-0.094 (0.072) |
-0.054 (0.067) |
|
Below bachelor Post-secondary |
0.032 (0.053) |
0.010 (0.058) |
-0.102 (0.066) |
-0.058 (0.063) |
|
January only |
-0.071**** (0.005) |
-0.051*** (0.008) |
-0.003 (0.022) |
0.103*** (0.020) |
|
April only |
-0.003 (0.009) |
0.034** (0.012) |
-0.013 (0.020) |
-0.064** (0.022) |
|
Oct. and Jan. |
-0.032**** (0.004) |
-0.015* (0.007) |
0.181**** (0.018) |
0.151*** (0.025) |
|
Oct. and April |
-0.155**** (0.010) |
-0.113**** (0.013) |
0.014 (0.019) |
0.034 (0.025) |
|
Jan. and April |
-0.052*** (0.010) |
-0.046*** (0.011) |
-0.102** (0.029) |
-0.086*** (0.017) |
|
Three responses |
-0.079*** (0.017) |
-0.039* (0.018) |
0.095*** (0.024) |
0.099*** (0.021) |
|
Constant |
1302 |
0.104 |
0.040 |
-0.081 |
|
R2 |
0.044 |
0.373 |
0.430 |
0.393 |
|
Observations |
1302 |
1287 |
327 |
323 |
Note: Standard errors are in parentheses.
* p <0.1, ** p <0.05, *** p <0.01, **** p <0.001
Appendix D: Analysis on Separate Levels of Government
|
Federal government |
Provincial government |
Municipal government |
||||
|---|---|---|---|---|---|---|
|
Model 1 |
Model 2 |
Model 1 |
Model 2 |
Model 1 |
Model 2 |
|
|
Satisfaction |
0.301** (0.052) |
0.308** (0.050) |
0.319** (0.043) |
|||
|
Public sector |
-0.058 (0.032) |
-0.052*** (0.003) |
-0.056** (0.007) |
-0.049 (0.028) |
-0.064* (0.017) |
-0.059 (0.024) |
|
ndp union |
-0.019 (0.015) |
0.000 (0.025) |
-0.015 (0.018) |
0.004 (0.006) |
0.014 (0.025) |
0.035 (0.029) |
|
Construction union |
-0.036 (0.081) |
-0.047 (0.068) |
0.012 (0.066) |
-0.001 (0.053) |
0.042 (0.066) |
0.029 (0.055) |
|
Atlantic |
-0.073 (0.036) |
-0.041 (0.033) |
-0.073 (0.034) |
-0.041 (0.023) |
-0.096 (0.041) |
-0.061 (0.032) |
|
West |
-0.014 (0.079) |
-0.002 (0.052) |
-0.011 (0.095) |
0.054 (0.027) |
-0.023 (0.098) |
-0.011 (0.068) |
|
North |
0.046 (0.035) |
0.042 (0.030) |
0.067 (0.029) |
0.063 (0.028) |
0.075 (0.038) |
0.072 (0.038) |
|
Woman |
0.071** (0.011) |
0.036*** (0.003) |
0.089** (0.014) |
0.054 (0.027) |
0.103* (0.029) |
0.066* (0.016) |
|
Nonbinary |
0.071 (0.0168) |
-0.006 (0.193) |
0.064 (0.198) |
-0.013 (0.230) |
-0.006 (0.005) |
-0.054 (0.191) |
|
Age |
-0.020 (0.009) |
-0.021 (0.016) |
-0.026 (0.010) |
-0.037 (0.017) |
-0.038** (0.007) |
-0.049* (0.014) |
|
Income |
0.003 (0.008) |
0.006 (0.009) |
-0.002 (0.005) |
0.000 (0.004) |
-0.006 (0.005) |
-0.003 (0.002) |
|
University |
0.011 (0.043) |
-0.030 (0.046) |
0.003 (0.051) |
-0.040 (0.055) |
0.090* (0.026) |
0.049* (0.015) |
|
Below bachelor |
-0.036 (0.069) |
-0.047 (0.067) |
-0.053 (0.080) |
-0.064 (0.079) |
-0.004 (0.045) |
-0.015 (0.004) |
|
January last response |
-0.036*** (0.001) |
-0.027** (0.003) |
-0.047*** (0.002) |
-0.035** (0.005) |
-0.059*** (0.002) |
-0.049*** (0.004) |
|
April last response |
-0.050** (0.006) |
-0.025* (0.008) |
-0.034** (0.007) |
-0.007 (0.010) |
-0.080*** (0.006) |
-0.054** (0.007) |
|
Constant |
0.172 |
0.099 |
0.231 |
0.156 |
0.262 |
0.185 |
|
R2 |
0.446 |
0.399 |
0.453 |
0.406 |
0.481 |
0.434 |
|
Observations |
1339 |
1332 |
1342 |
1335 |
1332 |
1325 |
Note: Standard errors are in parentheses.
* p <0.1, ** p <0.05, *** p <0.01, **** p <0.001
|
Federal government |
Provincial government |
Municipal government |
||||
|---|---|---|---|---|---|---|
|
Model 1 |
Model 2 |
Model 1 |
Model 2 |
Model 1 |
Model 2 |
|
|
Satisfaction |
0.258** (0.043) |
0.244* (0.065) |
0.244*** (0.017) |
|||
|
Public sector |
-0.072 (0.114) |
-0.033 (0.080) |
-0.088 (0.142) |
-0.047 (0.225) |
-0.012 (0.080) |
0.028 (0.054) |
|
Construction union |
-0.032 (0.172) |
-0.104 (0.213) |
-0.015 (0.188) |
-0.084 (0.225) |
0.033 (0.200) |
-0.037 (0.237) |
|
Woman |
0.050 (0.112) |
0.035 (0.105) |
0.122 (0.116) |
0.111 (0.115) |
0.142 (0.097) |
0.131 (0.095) |
|
Nonbinary |
-1.029** (0.166) |
-1.116** (0.139) |
-1.058** (0.167) |
-1.143** (0.134) |
-1.037*** (0.077) |
-1.130*** (0.041) |
|
Age |
-0.028 (0.017) |
-0.027 (0.013) |
-0.039 (0.018) |
-0.037 (0.018) |
-0.063 (0.024) |
-0.060 (0.023) |
|
Income |
0.001 (0.025) |
-0.003 (0.020) |
0.014 (0.021) |
0.010 (0.014) |
0.007 (0.014) |
0.003 (0.011) |
|
University |
0.010 (0.096) |
0.035 (0.094) |
-0.041 (0.105) |
-0.023 (0.100) |
-0.069** (0.007) |
-0.058 (0.027) |
|
Below bachelor |
-0.048 (0.081) |
-0.005 (0.079) |
-0.090 (0.094) |
-0.050 (0.093) |
-0.028 (0.034) |
-0.001 (0.039) |
|
January last response |
0.072 (0.031) |
0.109* (0.031) |
0.083 (0.031) |
0.114* (0.036) |
0.089** (0.019) |
0.130** (0.019) |
|
April last response |
0.040 (0.021) |
0.041 (0.019) |
0.036 (0.022) |
0.033 (0.023) |
0.088** (0.010) |
0.094** (0.013) |
|
Constant |
0.045 |
-0.038 |
-0.022 |
-0.102 |
-0.039 |
-0.113 |
|
R2 |
0.432 |
0.410 |
0.446 |
0.428 |
0.444 |
0.426 |
|
Observations |
368 |
366 |
368 |
366 |
373 |
370 |
Note: Standard errors are in parentheses.
* p <0.1, ** p <0.05, *** p <0.01, **** p <0.001
Appendix E: Analysis Omitting Union Sector from the Survey Weight
|
Rest of Canada |
Québec |
|||
|---|---|---|---|---|
|
Model 1 |
Model 2 |
Model 1 |
Model 2 |
|
|
Satisfaction |
0.308** (0.049) |
0.257** (0.045) |
||
|
Public sector |
0.061 (0.014) |
0.055* (0.016) |
0.043 (0.098) |
-0.001 (0.060) |
|
ndp union |
0.007 (0.009) |
-0.013 (0.016) |
||
|
Construction union |
-0.007 (0.070) |
0.006 (0.058) |
-0.002 (0.189) |
0.066 (0.231) |
|
Atlantic |
0.080 (0.036) |
0.047 (0.026) |
||
|
West |
0.013 (0.093) |
0.002 (0.064) |
||
|
North |
-0.067 (0.034) |
-0.062 (0.030) |
||
|
Woman |
-0.086*** (0.003) |
-0.052** (0.009) |
-0.096 (0.102) |
-0.087 (0.102) |
|
Nonbinary |
-0.053 (0.172) |
0.025 (0.203) |
1.064*** (0.102) |
1.151*** (0.061) |
|
Age |
0.029* (0.009) |
0.039 (0.016) |
0.040 (0.023) |
0.039 (0.020) |
|
Income |
0.002 (0.006) |
-0.001 (0.006) |
-0.007 (0.020) |
-0.004 (0.014) |
|
University |
-0.034 (0.037) |
0.006 (0.040) |
0.047 (0.051) |
0.028 (0.054) |
|
Below bachelor Post-secondary |
0.033 (0.064) |
0.043 (0.060) |
0.065 (0.060) |
0.025 (0.060) |
|
January response |
0.055*** (0.002) |
0.043*** (0.004) |
-0.106* (0.028) |
-0.141** (0.029) |
|
April response |
0.056** (0.006) |
0.031* (0.008) |
-0.074** (0.016) |
-0.073* (0.018) |
|
Constant |
-0.226 |
-0.151 |
0.024 |
0.112 |
|
R2 |
0.437 |
0.387 |
0.415 |
0.393 |
|
Observations |
1326 |
1319 |
361 |
359 |
Note: Standard errors are in parentheses.
* p <0.1, ** p <0.05, *** p <0.01, **** p <0.001
Appendix F: Ordered Logit Models
|
Rest of Canada |
Québec |
|||
|---|---|---|---|---|
|
Model 1 |
Model 2 |
Model 1 |
Model 2 |
|
|
Satisfaction |
1.569**** (0.213) |
1.297**** (0.118) |
||
|
Public sector |
-0.292 (0.132) |
-0.254*** (0.031) |
-0.397 (0.405) |
-0.130 (0.310) |
|
ndp union |
-0.143** (0.070) |
-0.065*** (0.020) |
||
|
Construction union |
-0.048 (0.312) |
-0.152 (0.261) |
-0.122 (1.112) |
-0.480 (1.294) |
|
Atlantic |
-0.471*** (0.178) |
-0.308** (0.156) |
||
|
West |
-0.106 (0.472) |
-0.076 (0.401) |
||
|
North |
0.231 (0.150) |
0.336** (0.170) |
||
|
Woman |
0.305**** (0.043) |
0.161*** (0.053) |
0.439 (0.469) |
0.443 (0.546) |
|
Nonbinary |
-0.052 (0.775) |
-0.304 (1.111) |
-23.590**** (1.621) |
-20.342**** (1.573) |
|
Age |
-0.119*** (0.037) |
-0.186*** (0.067) |
-0.312** (0.132) |
-0.340** (0.138) |
|
Income |
-0.021 (0.017) |
-0.008 (0.020) |
0.016 (0.094) |
-0.018 (0.085) |
|
University |
0.353** (0.156) |
0.115 (0.264) |
-0.641 (0.722) |
-0.610 (0.762) |
|
Below bachelor Post-secondary |
-0.079 (0.286) |
-0.244 (0.330) |
-0.681 (0.615) |
-0.636 (0.644) |
|
January response |
-0.226**** (0.017) |
-0.195**** (0.022) |
0.722**** (0.041) |
0.885**** (0.059) |
|
April response |
-0.214**** (0.034) |
-0.105** (0.044) |
0.391**** (0.032) |
0.316**** (0.031) |
|
R2 |
0.010 |
0.075 |
0.027 |
0.065 |
|
Observations |
1326 |
1319 |
361 |
359 |
Note: The table shows coefficients for ordered logit models. Note that these are not average marginal effects. Standard errors are in parentheses.
* p <0.1, ** p <0.05, *** p <0.01, **** p <0.001
1. David McGrane, The New ndp: Moderation, Modernization, and Political Marketing (Vancouver: ubc Press, 2019), 48–51.
2. Larry Savage, “Anybody-But-Conservative: Canadian Unions and Strategic Voting,” in Stephanie Ross and Larry Savage, eds., Rethinking the Politics of Labour in Canada, 2nd ed. (Halifax: Fernwood, 2021), 88–110; Thomas Collombat and Magali Picard, “Third-Party Activism,” in Alex Marland and Thierry Giasson, eds., Inside the Campaign: Managing Elections in Canada (Vancouver: ubc Press, 2020), 185–195.
3. See, for example, Michael T. Hartney, “Teachers’ Unions and School Board Elections: A Reassessment,” Interest Groups & Advocacy 11, 2 (2022): 237–262; Holger Sieg and Yu Wang, “The Impact of Unions on Municipal Elections and Urban Fiscal Policies,” Journal of Monetary Economics 60, 5 (2013): 554–567; Paul Clark and Marick F. Masters, “Competing Interest Groups and Union Members’ Voting,” Social Science Quarterly 82, 1 (2001): 105–116.
4. For the Canadian context, see Leo Panitch and Donald Swartz, From Consent to Coercion: The Assault on Trade Union Freedoms (Toronto: Garamond, 2003); Yonatan Reshef and Sandra Rastin, Unions in the Time of Revolution: Government Restructuring in Alberta and Ontario (Toronto: University of Toronto Press, 2003); Larry Savage, “Contemporary Party-Union Relations in Canada,” Labor Studies Journal 35, 1 (2010): 8–26; Larry Savage and Charles Smith, “Public Sector Unions and Electoral Politics in Canada,” in Stephanie Ross and Larry Savage, eds., Public Sector Unions in the Age of Austerity (Halifax: Fernwood, 2013), 46–56; Stephanie Ross, “The Challenge of Union Political Action in the Era of Neoliberalism: The Case of Ontario,” in Greg Albo and Bryan Evans, eds., Divided Province: Ontario Politics in the Age of Neoliberalism (Montreal and Kingston: McGill-Queen’s University Press, 2018), 522–548; Thomas Collombat and Xavier Lafrance, “Recomposition of the Québec Left and the Political Role of Trade Unions,” Recherches sociographiques 63, 1–2 (2022): 131–155; Peter Graefe, “Labour and Politics in Quebec,” in Ross and Savage, eds., Rethinking the Politics of Labour, 69–87; Larry Savage and Chantal Mancini, “Strategic Electoral Dilemmas and the Politics of Teachers’ Unions in Ontario,” Canadian Political Science Review 16, 1 (2022), doi:10.24124/c677/20221832. For a broader international or comparative perspective, see Leo Panitch, Working Class Politics in Crisis: Essays on Labour and the State (London: Verso, 1986); Gary Wolfe Marks, Unions in Politics: Britain, Germany, and the United States in the Nineteenth and Early Twentieth Centuries (Princeton: Princeton University Press, 1989); Steve Ludlam, Matthew Bodah, and David Coates, “Trajectories of Solidarity: Changing Union-Party Linkages in the UK and the USA,” British Journal of Politics and Industrial Relations 4, 2 (2002): 222–244; Gerassimos Moschonas, In the Name of Social Democracy: The Great Transformation, 1945 to the Present (London: Verso, 2002); Katrina Burgess, Parties and Unions in the New Global Economy (Pittsburgh: University of Pittsburgh Press, 2003); Elin Haugsgjerd Allern, Tim Bale, and Simon Otjes, “Mapping Party-Trade Union Relationships in Contemporary Democracies,” in Elin Haugsgjerd Allern and Tim Bale, eds., Left-of-Centre Parties and Trade Unions in the Twenty-First Century (Oxford: Oxford University Press, 2017), 1–45; Mary Hilson, Silke Neunsinger, and Iben Vyff, Labour, Unions and Politics under the North Star: The Nordic Countries, 1700–2000 (New York: Berghahn Books, 2017); Dennis Pilon and Larry Savage, “Working-Class Politics Matters: Identity, Class, Parties,” in Greg Albo, Stephen Maher and Alan Zuege, eds., State Transformations: Classes, Strategy, Socialism (Leiden: Brill, 2021), 76–98.
5. See, for example, Gad Horowitz, Canadian Labour in Politics (Toronto: University of Toronto Press, 1968); Richard Ulric Miller, “Organized Labour and Politics in Canada,” in Richard Ulric Miller and Fraser Isbester, eds., Canadian Labour in Transition (Toronto: Prentice-Hall, 1971), 204–239; Keith Archer, “The Failure of the New Democratic Party: Unions, Unionists and Politics in Canada,” Canadian Journal of Political Science 18, 2 (1985): 353–366; Keith Archer, Political Choices and Electoral Consequences: A Study of Organized Labour and the New Democratic Party (Montréal and Kingston: McGill-Queen’s University Press, 1990); Keith Archer and Alan Whitehorn, Political Activists: The ndp in Convention (Toronto: Oxford University Press, 1997); Harold Jansen and Lisa Young, “Solidarity Forever? The ndp, Organized Labour, and the Changing Face of Party Finance in Canada,” Canadian Journal of Political Science 42, 3 (2009): 657–678; Dennis Pilon, Stephanie Ross, and Larry Savage, “Solidarity Revisited: Organized Labour and the New Democratic Party,” Canadian Political Science Review 5, 1 (2011): 20–37; Larry Savage, “Organized Labour and the ndp: Looking Back on Sixty Years of Party-Union Relations,” Labour/Le Travail, no. 88 (Fall 2021): 77–112; Alan Ernst and Bryan Evans, “Struggling to Survive: The New Democratic Party and Labour in the Neoliberal Era,” in Ross and Savage, eds., Rethinking the Politics of Labour, 48–68.
6. Horowitz, Canadian Labour in Politics, 227–233.
7. For a complete breakdown, see Horowitz, Canadian Labour in Politics, 255–256.
8. Savage and Smith, “Public Sector Unions”; Larry Savage and Nick Ruhloff-Queiruga, “Organized Labour, Campaign Finance, and the Politics of Strategic Voting in Ontario,” Labour/Le Travail, no. 80 (Fall 2017): 255.
9. Lynda Erickson and David Laycock, “The ndp and Quebec,” in David Laycock and Lynda Erickson, eds., Reviving Social Democracy: The Near Death and Surprising Rise of the Federal ndp (Vancouver: ubc Press, 2015), 64–66.
10. Collombat and Lafrance, “Recomposition of the Québec Left”; Savage, “Contemporary Party-Union Relations,” 23.
11. Robert Laxer, Canada’s Unions (Toronto: James Lorimer, 1976), 263.
12. Desmond Morton, Working People: An Illustrated History of the Canadian Labour Movement, 4th ed. (Montréal and Kingston: McGill-Queen’s University Press, 1998), 315.
13. Richard Johnston, The Canadian Party System: An Analytic History. (Vancouver: ubc Press, 2017).
14. Janine Brodie and Jane Jenson, Crisis, Challenge and Change: Party and Class in Canada Revisited (Ottawa: Carleton University Press, 1988).
15. Johnston, Canadian Party System, 180–185.
16. Archer, Political Choices, 56–58; Archer, “Failure of the New Democratic Party,” 357.
17. Richard Johnston, André Blais, Henry E. Brady, and Jean Crête, Letting the People Decide: Dynamics of a Canadian Election (Stanford: Stanford University Press, 1992), 89–90; Johnston, Canadian Party System, 176.
18. Lynda Erickson and David Laycock, “Building for a Breakthrough: The Layton Years, 2003–2011,” in Laycock and Erickson, eds., Reviving Social Democracy, 50–51.
19. Archer, “Failure of the New Democratic Party,” 360.
20. Brodie and Jenson, Crisis, Challenge and Change, 253.
21. Archer, Political Choices, 58.
22. Thomas Walkom, Rae Days: The Rise and Follies of the ndp (Toronto: Key Porter, 1994), 3.
23. Dick Proctor quoted in Walkom, Rae Days, 4.
24. Ross, “Challenge of Union Political Action”; Larry Savage, “The Shifting Landscape of Party-Union Relationships in Ontario,” in Cheryl N. Collier and Jonathan Malloy, eds., The Politics of Ontario, 2nd ed. (Toronto: University of Toronto Press, 2024), 287–309.
25. McGrane, New ndp.
26. Savage, “Organized Labour.”
27. McGrane, New ndp, 68.
28. McGrane, New ndp, 223, 245.
29. See, for example, Daniel Roy, “Le Bloc québécois: un parti progressiste qui défend les intérêts des travailleurs du Québec,” Syndicat des Métallos, 28 April 2011, https://www.metallos.org/actualites-et-medias/actualites/le-bloc-quebecois-un-parti-progressiste-qui-defend-les-interets-des-travailleurs-du-quebec/.
30. Radio-Canada, “La ftq appuie les candidats néo-démocrates du Saguenay-Lac-Saint-Jean,” 20 September 2015, https://ici.radio-canada.ca/nouvelle/739943/ftq-npd-election/; Jean-Luc Lavallée, “La ftq a ciblé 8 circonscriptions pour barrer la route aux conservateurs,” Le Journal de Montréal, 13 January 2015, https://www.journaldemontreal.com/2015/01/13/ftq---npd.
31. McGrane, New ndp, 304–305.
32. Savage and Ruhloff-Queiruga, “Organized Labour”; Brad Walchuk, “Changing Union-Party Relations in Canada: The Rise of the Working Families Coalition,” Labor Studies Journal 35, 1 (2010): 27–50.
33. Althia Raj, “Justin Trudeau Meets Privately with ‘Very Tough’ Canadian Labour Congress,” Huffpost, 10 November 2015, updated 11 November 2015, https://www.huffpost.com/archive/ca/entry/justin-trudeau-meets-privately-with-very-tough-canadian-labour_n_8526072.
34. Chris Hall, “Trudeau’s Not-So-Subtle Strategy to Steal ndp Applause: Chris Hall,” cbc News, 26 August 2016, https://www.cbc.ca/news/politics/trudeau-strategy-union-ndp-1.3735987.
35. Joanna Smith, “Jerry Dias, Unifor President, Brought in as ‘Legitimate Stakeholder’ on nafta Negotiations,” Global News, 24 October 2017, https://globalnews.ca/news/3821245/jerry-dias-nafta-talks/.
36. Stephanie Ross and Larry Savage, Shifting Gears: Canadian Autoworkers and the Changing Landscape of Labour Politics (Vancouver: ubc Press, 2024), 203–206.
37. Elections Canada, “Third Party Financial Returns for the 43rd General Election,” accessed 27 December 2024, https://www.elections.ca/content.aspx?section=fin&dir=oth/thi/advert/tp43&document=index&lang=e.
38. Savage, “Anybody-But-Conservative,” 106.
39. Elections Canada, “Third Parties’ Financial Returns,” accessed 27 December 2024, https://www.elections.ca/content.aspx?section=fin&dir=oth/thi/advert&document=index&lang=e. See returns from 37th general election, 27 November 2000; 38th general election, 28 June 2004; 39th general election, 23 January 2006; 40th general election, 14 October 2008; 41st general election, 2 May 2011; 42nd general election, 19 October 2015; 43rd general election, 21 October 2019; 44th general election, 20 September 2021.
40. Elections Canada, “Third Party Financial Returns for the 44th General Election,” accessed 27 December 2024, https://www.elections.ca/content.aspx?section=fin&dir=oth/thi/advert/tp44&document=index&lang=e.
41. Tara Carman, “Unions Top Funders of Third Party Election Ads, Financial Records Show,” cbc News, 18 October 2019, https://www.cbc.ca/news/politics/unions-third-party-ads-finance-1.5325330.
42. Ross and Savage, Shifting Gears, 209–211.
43. Matthew Polacko, Simon Kiss, and Peter Graefe, “The Changing Nature of Class Voting in Canada, 1965–2019,” Canadian Journal of Political Science 55, 3 (2022): 663–686; Ross and Savage, Shifting Gears.
44. tvo, “The pc Party’s Labour Charm Offensive,” The Agenda with Steve Paikin, 25 November 2021, transcript, https://www.tvo.org/transcript/2679359.
45. Jaime Watt, “Doug Ford’s Labour of Love: A Hard Hat Revolution as pcs Win over construction unions,” Toronto Star, 22 May 2022, https://www.thestar.com/opinion/contributors/doug-ford-s-labour-of-love-a-hard-hat-revolution-as-pcs-win-over-construction/article_9c333bfd-df7b-580f-bf06-782c4ad4fbba.html.
46. Savage, “Shifting Landscape,” 302.
47. Savage, “Shifting Landscape,” 302–303.
48. Arthur Lupia, “Shortcuts versus Encyclopedias: Information and Voting Behavior in California Insurance Reform Elections,” American Political Science Review 88, 1 (1994): 63–76.
49. On ekos’ online panel, see “Probit,” ekos Politics, accessed 10 May 2024, https://www.ekospolitics.com/index.php/probit/.
50. We counted the Canadian Union of Public Employees, United Steelworkers, International Association of Machinists and Aerospace Workers, and the United Food and Commercial Workers as ndp-affiliated unions.
51. We counted the following unions as construction unions: the International Association of Heat and Frost Insulators and Allied Workers; the International Association of Bridge, Structural, Ornamental, and Reinforcing Iron Workers; the Operative Plasterers’ and Cement Masons’ International Association of the United States and Canada; the International Brotherhood of Electrical Workers; the International Brotherhood of Teamsters; the International Union of Bricklayers and Allied Craftworkers; the International Union of Elevator Constructors; the International Union of Operating Engineers; the International Union of Painters and Allied Trades; the Laborers International Union of North America; the United Association of Journeymen and Apprentices of the Plumbing and Pipefitting Industry of the United States and Canada; the Sheet Metal, Air, Rail, and Transportation Workers; and the Sheet Metal Workers’ International Association, ftq-Construction; and csn-Construction.
52. The gender variable was broken into men, women, and nonbinary individuals. Coefficients for the nonbinary category have been suppressed from the figures in the main body of the paper because of the very small number of respondents in that category.
53. Coefficients for the North region category are suppressed because the number of respondents is too small to make the coefficients meaningful.
54. Standard errors are a measure of the variability of estimates. Clustering standard errors by the last wave of the survey each respondent responded to allows us to group the standard errors in a way that accounts for any correlations between the error term (the difference between the observed value and the true value) and the specific wave of the survey that the respondent participated in. This methodological choice helps to address potential biases or correlations that might arise due to the structure of the survey waves.
55. When conducting robustness checks analyzing different waves of the survey on their own, we did not weigh by whether respondents were in public- or private-sector unions. This is because including union sector in such weights for the individual waves would have led to extreme weighting values being assigned to a number of respondents in the surveys.
56. This is calculated by subtracting the low end of the 95% confidence range for the estimate of responsiveness to endorsements of federal parties and candidates from the high end of the 95% confidence range for the estimate of responsiveness to endorsements of municipal candidates. Essentially, we are asking what the difference between the two estimates would be if the federal estimate is as low as it can be while remaining in our 95% confidence range and our municipal estimate is as high as it can be while remaining within our 95% confidence range.
57. Bivariate regression analysis shows that the differences in responsiveness to union endorsements between Québec and the rest of Canada are statistically significant at the 95% confidence level for each level of government.
58. It should be noted that we have fewer respondents from Québec than from the rest of Canada, which means the margins error for our estimates for Québec are larger than those for the rest of Canada. There are 439 (22%) respondents from Québec and 1514 (78%) from the rest of Canada. Calculated using the same method as is described in footnote 59, this difference is 0.19 points.
59. For example, there is always a danger that results could be affected by reverse causation, omitted variable bias, and social desirability bias. Future work could make use of survey experiments to further test the relationship between satisfaction with one’s union and responsiveness to union endorsements.
How to cite:
Larry Savage and Daniel Westlake, “Union Endorsements and the Voting Intentions of Union Members in Canada,” Labour/Le Travail 95 (Spring 2025): 87–120, https://doi.org/10.52975/llt.2025v95.006.
Copyright © 2025 by the Canadian Committee on Labour History. All rights reserved.
Tous droits réservés, © « le Comité canadien sur l’histoire du travail », 2025.